In the dynamic world of financial markets, understanding price movements is paramount to successful trading. Among the most fundamental and widely used concepts for technical analysis are support and resistance levels. These key price zones act like invisible boundaries, influencing where asset prices might pause, reverse, or accelerate. Mastering a support and resistance trading strategy can significantly enhance a trader’s ability to identify effective entry points and exit points, regardless of whether you’re involved in Forex trading strategies, Cryptocurrency trading, Binary Options strategies, or traditional stocks. This comprehensive guide will delve deep into what support and resistance are, how to accurately identify and draw them, and various trading strategies to capitalize on these crucial market dynamics.
What are Support and Resistance? The Pillars of Price Action
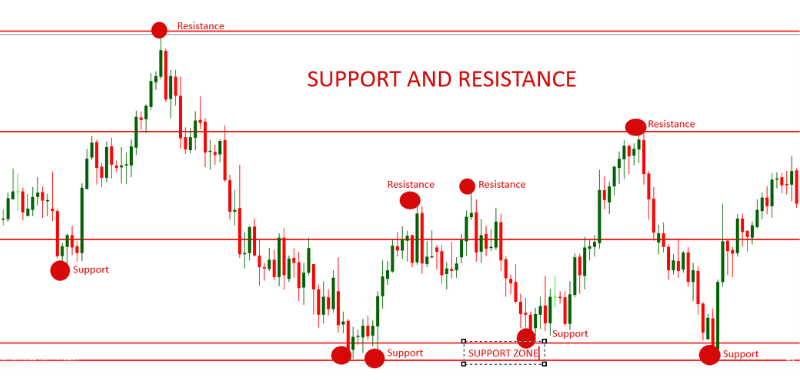
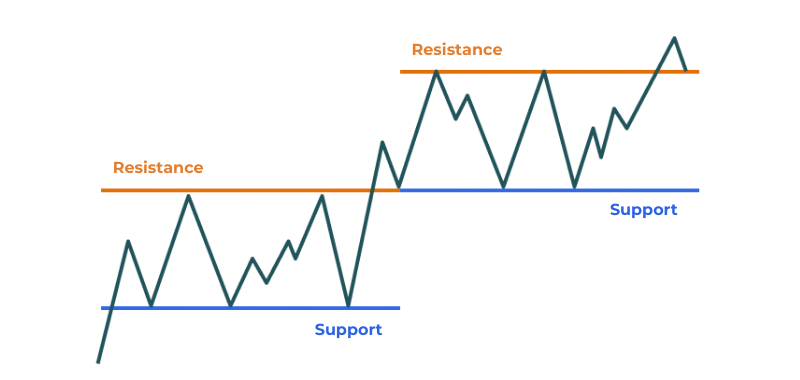
Imagine the price of an asset moving between a floor and a ceiling made of glass. The floor represents support, a price level where a downtrend is expected to pause or reverse upwards. Conversely, the ceiling represents resistance, a price level where an uptrend is expected to halt or reverse downwards.
• Support: A support level is a zone of lower prices where demand typically overcomes supply, preventing the price from falling further. When the price drops to a support, buyers often see it as an opportunity to purchase, leading to a bounce or reversal.
• Resistance: A resistance level is a zone of higher prices where supply usually overwhelms demand, hindering the price from climbing higher. As the price approaches resistance, sellers tend to enter the market, pushing the price back down or causing it to consolidate.
These levels are not arbitrary; they are the result of collective investor psychology and behavior. Traders tend to react to similar price points, such as round numbers, historical highs or lows, which in turn reinforces these levels.
Types of Support and Resistance: Horizontal, Oblique, and Dynamic
Not all support and resistance levels are created equal. They can be categorized based on their appearance and how they interact with price over time:
1. Fixed (Horizontal) Support and Resistance: These are the most common types, represented by horizontal lines on a chart. They correspond to specific, unchanging price levels where the market has previously reversed or consolidated.
◦ Identification Methods: Fixed levels are often marked at significant extremes (highest highs or lowest lows), round psychological numbers (e.g., $10, $50, $100), historical references (e.g., IPO price), Fibonacci retracement levels, or pivot points. These are considered some of the most important levels for operations.
2. Oblique (Trendline) Support and Resistance: These are diagonal lines that represent levels where the price has bounced or reacted, but unlike fixed levels, their price point evolves over time with a constant slope.
◦ Identification Methods: Primarily identified by drawing trendlines connecting consecutive highs in a downtrend (oblique resistance) or lows in an uptrend (oblique support). They can also be part of chart patterns like channels, wedges, pennants, or flags.
3. Dynamic Support and Resistance: These levels are not fixed but vary continually, often represented by curves generated by technical indicators.
◦ Identification Methods: Popular dynamic S/R levels include Moving Averages (simple, exponential, triangular), Bollinger Bands (upper band acts as resistance, lower as support), or elements of the Ichimoku Kinko Hyo indicator. Dynamic lines are generally considered less secure than fixed S/R because the price doesn’t bounce at the same exact point.
How to Identify and Draw Support and Resistance Accurately

The accuracy of your S/R lines is crucial for profitable trading. Many traders struggle because they mark lines incorrectly or in non-significant areas. Here’s a detailed approach:
1. Focus on Extremes: Always start by identifying the highest highs and lowest lows in your chart. These are often the most important fixed support and resistance levels.
2. Look for Multiple Retests (The “Rule of Two/Three”): A support or resistance level gains validity the more times the price has touched and respected it. Before taking a trade, it’s recommended to wait for at least two previous touches/rejections of a line before operating on the third occasion. This increases the reliability of your retest strategy.
3. Identify “Z-Zones” (Drastic Movements): A strong support or resistance often originates from a point where the price initiated a significant, drastic movement. These powerful impulses, especially if composed of several strong candles with minimal retracements, mark valid and important levels.
4. Recognize Change of Polarity (Flip Zones): A previously broken support can become a new resistance, and vice versa. This phenomenon, often called a “flip,” indicates a shift in market sentiment around that price level. For instance, if price breaks a resistance and then retraces, that former resistance might now act as a support.
5. Draw Zones, Not Just Lines: Support and resistance are typically zones rather than exact lines. When drawing, aim to connect the most touched areas, considering both candle closures/openings and wick tips. Don’t strictly draw at the absolute highest wick or the exact close, as this can lead to missed trades or false breaks.
6. Use Averaged Lines: A highly effective method, especially when wicks and closes are irregular, is to draw an “averaged line”. This involves finding a midpoint between the highest/lowest wick and the candle’s closing/opening price that initiated the movement change. This averaged line often provides a more precise entry point.
7. Prioritize Obvious and Recent Levels: Focus on S/R levels that are most obvious and easily recognizable, as more traders and algorithms will observe them, reinforcing their effectiveness. Furthermore, recently formed movements carry more weight than older ones; typically, look at the last 100-200 candles on your chart. Avoid cluttering your chart with old, irrelevant lines.
8. Confirm with Candlestick Parity/Decision: A crucial confirmation for any S/R level is how the price approaches it. When the price reaches an S/R with a decisive candle – one with good volume, an extended body, and closing close to your marked line – it indicates strong intent and a higher probability of respecting the level. Conversely, if the price approaches with small candles or low volume, it signals weakness and a higher chance of a false breakout or disrespect.
Powerful Support and Resistance Trading Strategies
With accurately drawn S/R levels, traders can employ various strategies:
1. Fade Trading Strategy (Reversal Strategy): This strategy involves betting on the strength of a support or resistance level, anticipating a reversal.
• At Support: If the price reaches a strong support level and shows candlestick confirmation (e.g., bullish reversal patterns, large decisive candles respecting the line), a trader might buy (long). A stop-loss order would be placed just below the support, and a take-profit order at the next resistance level. Limit orders are often used for precise entries.
• At Resistance: If the price reaches a strong resistance level with similar confirmations (e.g., bearish reversal patterns), a trader might sell (short). The stop-loss would be just above the resistance, and take-profit at the next support.
2. Breakout Trading Strategy: This strategy involves betting on an acceleration of price after a significant support or resistance level is broken.
• Resistance Breakout (Buy): If the price decisively breaks above a resistance level (often with strong volume and a large candle), a trader might buy (long), anticipating a continuation of the upward movement. The stop-loss would be just below the broken resistance (which often becomes new support), and take-profit at the next resistance level. Stop orders are commonly used here.
• Support Breakout (Sell): If the price decisively breaks below a support level, a trader might sell (short), expecting a further decline. The stop-loss would be just above the broken support (which becomes new resistance), and take-profit at the next support level.
3. Pullback Trading Strategy: This is often an advanced variation of the breakout strategy. After a breakout, the price frequently retraces (pulls back) to test the broken level. This previously broken S/R now acts as its inverse (e.g., old resistance becomes new support). Traders enter during this pullback, betting on the continuation of the original breakout direction.
4. Double Confirmation/Convergence Strategy: To increase reliability, traders often combine S/R analysis with other technical analysis for traders tools. For instance, looking for S/R levels that align with Fibonacci levels, Moving Averages, or specific chart patterns can provide stronger confirmations. This convergence of multiple indicators at a single price point makes the S/R level more significant.
Enhancing Validity and Mitigating Risks
Successful implementation of a support and resistance trading strategy requires more than just drawing lines. It involves crucial considerations for risk management and understanding trading psychology.
• Underlying Trend: Always consider the prevailing market trend. In an uptrend (bull market), supports tend to be stronger, offering better buying opportunities. In a downtrend (bear market), resistances are more robust, presenting better selling opportunities.
• Volume Analysis: A surge in trading volume at an S/R level indicates significant market interest and strengthens the validity of that level.
• Resilience of the Level: While multiple touches validate a level, observe if the price is increasingly struggling to bounce or retreat from it. A weakening bounce suggests the level might soon break.
• Risk Management: Trading inherently involves risks. S/R levels are not infallible and prices can behave unpredictably. Always use stop-loss orders to limit potential losses and take-profit orders to secure gains. Never risk more capital than you can afford to lose.
• Practice and Experience: Identifying and trading S/R effectively requires constant practice and experience. Utilize demo accounts to test your strategies and develop your skills without risking real capital.
Conclusion
Support and resistance are indispensable tools for any trader engaging in technical analysis. They provide a framework for understanding market dynamics driven by supply and demand and trading psychology. By mastering the art of identifying and accurately drawing these levels – whether fixed, oblique, or dynamic – and employing disciplined trading strategies like fade trading and breakout trading, traders can significantly improve their decision-making. Remember to always seek candlestick confirmation, consider trading volume, and integrate comprehensive risk management. With persistent practice and a deep understanding of these concepts, you can navigate the financial markets with greater confidence and precision.

