If you’ve ever looked at a trading chart, chances are you’ve seen a forest of red and green bars — these are candlesticks. They are the most popular way to visualize price action in trading, whether you’re analyzing forex, stocks, crypto, or commodities.
Candlestick charts don’t just show you prices; they tell a story about market sentiment, momentum, and possible future moves. Learning to read them is like learning a new language — once you understand it, you’ll never look at the markets the same way again.
In this guide, we’ll start from the basics of what candlesticks are and how they’re formed, move on to different types of candlesticks, and finish with how to interpret them like a pro.
What is a Candlestick Chart?
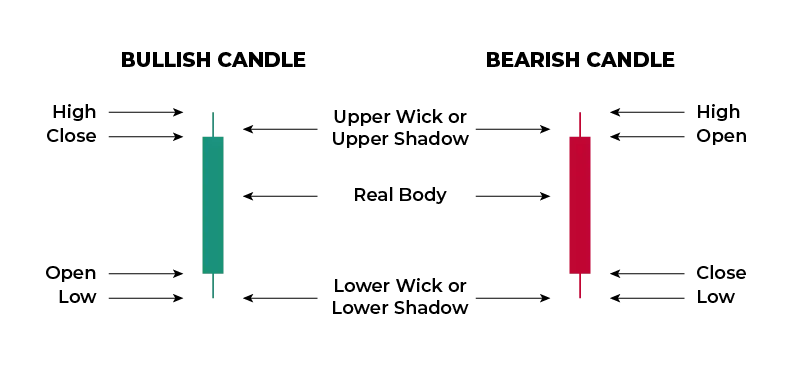
A candlestick chart is a type of financial chart used to represent the price movement of an asset over a specific period of time. Each candlestick shows four key pieces of data:
- Open – the price when the period started.
- Close – the price when the period ended.
- High – the highest price reached during the period.
- Low – the lowest price reached during the period.
Candlesticks can represent any time frame — from one minute to one month — depending on your trading style and chart settings.
The Anatomy of a Candlestick
A candlestick has two main parts:
- The Body: The thick part of the candle that shows the difference between the opening and closing prices.
- The Wick (or Shadow): The thin lines above and below the body, showing the highest and lowest prices during the time period.

Colors Matter:
- Green (or White) Candle: The closing price is higher than the opening price → a bullish candle.
- Red (or Black) Candle: The closing price is lower than the opening price → a bearish candle.
Beginner’s Tip: In most charting platforms, you can customize the colors, but green for bullish and red for bearish is the standard.
Main Types of Candlesticks
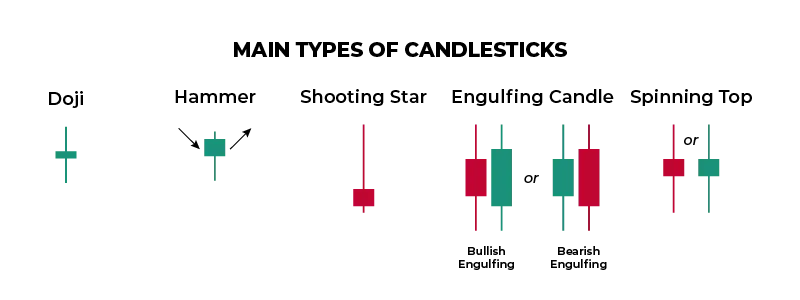
Candlesticks come in many shapes and sizes. Each one can provide clues about what’s happening in the market. Let’s look at some of the most important ones:

1. Doji
- Appearance: Very small or no body, with wicks on both sides.
- Meaning: Market indecision. Buyers and sellers are equally strong.
- Pro Tip: A Doji after a strong trend can signal a possible reversal.
2. Hammer
- Appearance: Small body at the top with a long lower wick.
- Meaning: Sellers pushed the price down, but buyers regained control.
- Pro Tip: Often found at the bottom of a downtrend, indicating potential bullish reversal.
3. Shooting Star
- Appearance: Small body at the bottom with a long upper wick.
- Meaning: Buyers tried to push the price up but sellers took over.
- Pro Tip: Often found at the top of an uptrend, signaling potential bearish reversal.
4. Engulfing Candle
- Appearance: A candle that completely “engulfs” the previous candle’s body.
- Meaning: Strong momentum shift — bullish engulfing suggests strong buying, bearish engulfing suggests strong selling.
5. Spinning Top
- Appearance: Small body with long wicks on both sides.
- Meaning: Market indecision and low momentum.
Candlestick Patterns Every Trader Should Know
Candlesticks become even more powerful when viewed in patterns rather than individually. Here are a few examples:
- Bullish Engulfing Pattern: Strong sign of potential upward movement.
- Bearish Engulfing Pattern: Strong sign of potential downward movement.
- Morning Star: A three-candle pattern that signals bullish reversal.
- Evening Star: A three-candle pattern that signals bearish reversal.
- Three White Soldiers: Three long green candles → strong bullish sentiment.
- Three Black Crows: Three long red candles → strong bearish sentiment.
How to Read Candlesticks Like a Pro
To truly read candlestick charts like a professional, you need to combine individual candle analysis with overall market context:
- Look at the Trend First
- Candles mean different things in uptrends, downtrends, and sideways markets.
- Check Volume
- High volume with a strong candle increases the reliability of the signal.
- Watch for Key Levels
- Support and resistance levels make candlestick patterns more powerful.
- Combine with Other Indicators
- Moving averages, RSI, or MACD can confirm your candlestick analysis.
Common Mistakes to Avoid
- Over-relying on single candles: Always look for confirmation from the next candles and other indicators.
- Ignoring the bigger time frames: A bullish candle on a 5-minute chart may be meaningless in the daily trend.
- Forgetting about news events: Candles can be distorted during high volatility news releases.
Final Thoughts
Candlestick charts are one of the most powerful tools a trader can use. They give you an instant visual representation of market psychology and price action. But remember: a candlestick is just a clue — not a guarantee. The real skill comes from combining candlestick reading with broader technical and fundamental analysis.
Action Step: Open your charting platform, pick one asset, and study the last 50 candlesticks. Identify their types, patterns, and the context in which they appeared.

